Year 15

Birthday candles” by synx508 is licensed under CC BY-NC 2.0.

I really have hardly written anything here except flight and ride logs (with maybe 4 or 5 exceptions) since about 2010. I’ve never really posted much (maybe anything?) here about work or my infosec/blueteam/DFIR interests. However, today, mostly because I was trying to remember when the Tour de Donut ride was that I got the t-shirt I’m wearing today, I did a very quick run back through the history of this blog. When it started it was over on Blogger, I moved it to my own server when Blogger went through some changes that made it more of a pain to use. It has been running on a VPS for quite a few years now. But, while looking through all those old posts, I realized that I actually started this (and the church blog) in January of 2008, which means this blog is now 15 years old. I don’t know if I will ever get back to writing much here. I am so frustrated with politics these days that I feel like I should just to get it off my chest, but I can’t bring myself to go to the effort of actually writing it up. These days, when I see what has become of the Republican party that I belonged to for more than 25 years, it makes me sick. Tonight will be the President Biden’s State of the Union address, which, honestly, I probably won’t watch, and which will be followed by some vacuous meanderings from Sarah Huckabee Sanders. Kevin McCarthy has sold his soul to become Speaker of the House and will soon manufacture a debt ceiling crisis without having any sort of plan for how to deal with the debt he suddenly claims is the most important issue of our time. I know that the Democrats aren’t saints, but at least they are willing to talk about real issues that effect real people, and have some sort of a governing philosophy. The Republican party simple exists to blow stuff up. And, that make me very sad. So, I’ll probably go quiet again for months or years after this post, but I am still here. I am still thinking about these things. These days, I mostly just like or retweet posts on twitter that are in line with my political/religious/spiritual leanings, but as I said, I just can bring myself to expend the energy to put them in my own words.

I haven’t posted a Year in Riding or a Year in Flying for several years because I have done very little to none of that for several years. I’ve kept my FAA 3rd class (well, Special Issuance) medical current, but haven’t actually operated the controls of an airplane since 2016. I hope to rectify that this year, but I thought the same last year. I didn’t even get 100 miles in on my bike last year because of another herniated disk. I was doing well and thought that 2022 would be a better year, right up until the Friday before Easter. That day, I was mowing the lawn and got the zero turn mower stuck in the mud (not all that unusual an occurrence, especially in the spring). I stood up to step off the mower and pull it out of the mud and had excruciating pain in my lower back and running down my left leg. I suffered through the weekend and on Mon went to my chiropractor since he had gotten me through a similar incident back in about 2014 or so by using the traction machine. This time, though, when the “decompression” finished I was in so much pain I could barely get off the table and could not sit down. I immediately went across the street to the OrthoNeuro Urgent Care (which closed a few months later). To make a long story short, I was using a cane to get around for the next 2 months. I got 2 steroid injections in my back. One in May, the second in June, which helped tremendously. I was able to ditch the cane in late-June or early-July and the pain finally completely disappeared in mid-to-late Nov.

I also never posted here about finally becoming a SANS Certified Instructor which occurred during the pandemic (Sep 2021). The last half of 2022, I finally was able to teach in-person classes again and got to travel on SANS’ dime as I taught in Austin, TX; Sydney, Australia; Prague, Czechia; Tokyo, Japan; and Paris, France in the last 5 months of the year. In fact, I had 9 trips of 7+ days in the second half of 2022 including the 2 annual visits to the parental units in Durham, NC in July and Dec. After the latter, I finally fell victim to Covid despite having a total of 4 shots for it (the second booster, the bivalent one in Sep shortly before the beginning of the international travel). I’ll be traveling again (including internationally) to teach in 2023, but not at the same pace as those last 5 months of last year.

I’m pretty sure that no one but me actually has read anything there that I didn’t put a link to on Facebook or some other social media site, but Happy Birthday to me (well, my blog anyway).
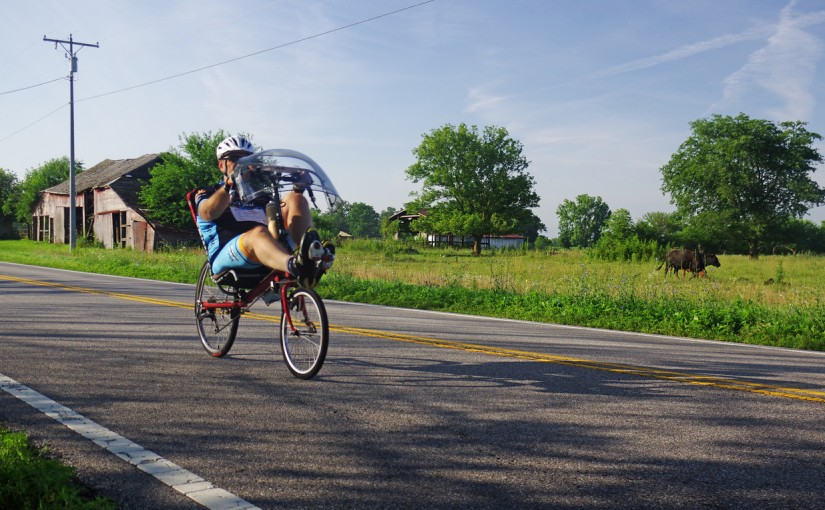
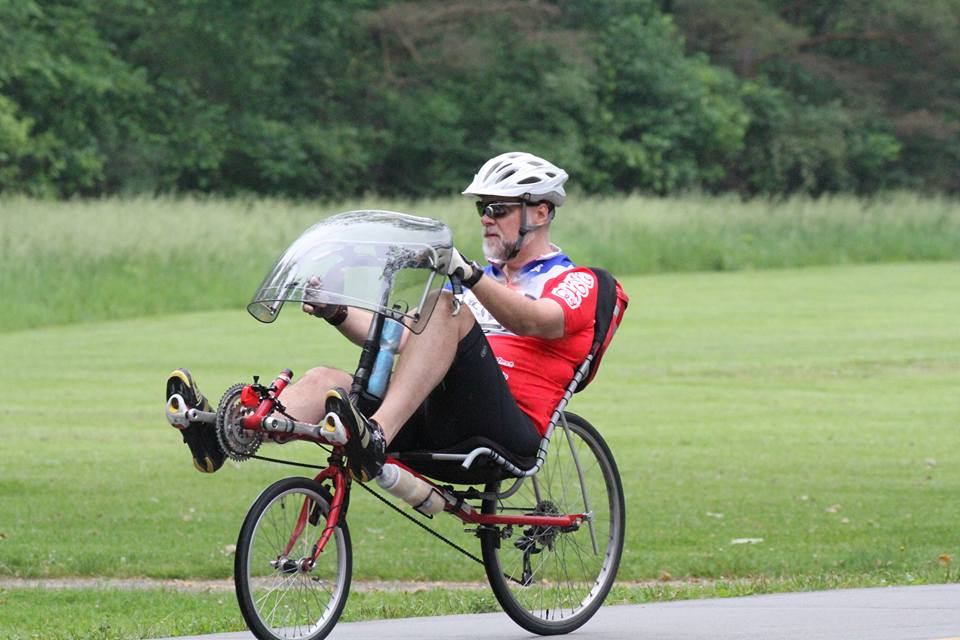
The Year in Riding (2018)

Unfortunately, due to continuing problems with my feet and lots of traveling, I didn’t get to ride nearly as much as I would have liked (again). This is the fewest miles I’ve ridden (including the year without major heart issues) since I first got back on my bike 7 years ago. Also, I was the heaviest I’ve been in a long time, I never got below 220 the entire year (I usually get down around 205 by Aug), so there was that, too, which contributed to the lower than usual average speed.

I rode only 1 organized ride this year. The Tour de H2O and I only rode the 25 miler rather than the half- or metric century because I had no real base built up. I also registered for, but did not ride, the Ride 2 Recovery Honor Ride (making the 2nd year in a row I missed that.

  • Tour de H2O – 25.13 mi (40.44 km) in 1:41:08, avg – 14.91 mph (24.00 km/h), max grade – 6.3%, total climbing – 471 ft (144 m). Nasty hill and headwind the last 2 miles.

  • Total number of rides = 21
  • Total mileage – 391.59 mi
  • Total time – 28:26:06
  • Total climbing – 8,553 ft
  • Avg speed = 14.26 mph (22.95 km/h)
  • Avg time of ride = 1:22:18
  • Avg length of ride = 19.58 mi (31.51 km)
  • Rides over 20 mi = 10
  • Rides over 29.75 mi = 1
  • Rides over 50 mi = 0 (for the second time since 2012)
  • Rides over 1:30:00 = 8 (up 1 from last year)
  • Rides over 2:00:00 = 1 (down one from last year)
  • Rides over 3:00:00 = 0 (for the second year in a row)

The Year in Riding (2017)

Note: Just realized that I wrote this in Feb, but it was still in draft state until now (31 July). Sigh…

Running a little late, but I need to do my normal year-end wrap up of my time on the bike in 2017. Unfortunately, due to a foot injury and lots of traveling, I didn’t get to ride nearly as much as I would have liked. This is the fewest miles I’ve ridden (in a year without major heart issues) since I first got back on my bike 6 years ago.

I rode 4 of the 6 organized rides I paid for this year. The first one was the Tour de Forest which I registered for, but didn’t ride last year because it was just too friggin cold, This year it was warmer, but it poured down rain during the last half of the ride. I missed the Honor Ride for the first time in 4 years due to a flat tire that couldn’t be repaired without buying a new tire. I also was off the bike for 5 weeks at the peak of the season (early-July to mid-Aug) due to a foot injury that resulted in a Doctor prescribing orthotics due to what is apparently arthritis in the ball of the left foot.

  • Tour de Forest – 29.22 mi (47.03 km) in 2:21:02, avg – 12.43 mph (20.00 km/h), max grade – 19.4%, total climbing – 1590 ft (890 m). I ended walking up significant portions of 2 of the hills.
  • London Strawberry Festival Ride – 44.10 mi (70.97 km) in 2:57:28, avg – 14.91 mph (24.00 km/h).  Headwinds and the climbs (such as they were) in the first half had me averaging only 13.7 mph (22.0 km/h) at the 23 mile mark. Strawberries at the rest stops, but not at the finish.
  • Tour de Buckeye Lake – 25.41 mi (40.89 km) in 1:49:45, avg – 13.89 mph (22.35 km/h). Some hills and some wind. This is a brand new ride and was kind of fun. Not sure if I’ll ride it next year (kind of depends on when it is), but the food at the winery was really good.
  • Ox Roast Ride – 29.27 mi (47.11 km) in 1:56:37, avg – 15.01 mph (24.16). I actually missed a turn (and had paused the GPS and forgot to restart it after the last rest stop). It was actually every bit of a metric half-century at right around 2 hours. I couldn’t wait for my ox sandwich this year though.

  • Total number of rides = 25
  • Total mileage – 540.53 mi
  • Total time – 35:32:09
  • Total climbing – 10,499 ft (36.2% of the way up Mt Everest)
  • Avg speed = 15.21 mph (24.48 km/h)
  • Avg time of ride = 1:25:17
  • Avg length of ride = 21.62 mi (34.79 km)
  • Rides over 20 mi = 15
  • Rides over 29.75 mi = 3
  • Rides over 50 mi = 0 (for the first time since 2012)
  • Rides over 1:30:00 = 7
  • Rides over 2:00:00 = 2
  • Rides over 3:00:00 = 0


Strawberry Festival Ride 2017

Head wind (and the worst climbs) in the first 23 miles (37 km). I was only averaging 13.7 mph (22.0 km/h) at the turn, but averaged 16.4 (26.4 km/h) over the last 21 mi (34 km, 1:16:23 of riding). Temp (min/avg/max) – 66.2/72.9/80.6°F, wind from SW @ 7, max grade – 6.4%, total climbing – 695 ft (212 m), cadence (avg/max) – 74.9/92, HR (avg/max) – 159.8/180, HRM zones 3-5 2:08, power (avg/max) – 149/556W. 44.10 mi (70.97 km) in 2:57:28, avg – 14.91 mph (24.00 km/h), max – 26.8 mph (43.1 km/h). Unfortunately, the actual Strawberry Festival is in 2 weeks, but they did have strawberries at the rest stops, just not at the finish 🙁


;

Tour de Forest 2017

My first organized ride of the year, this past Saturday, was likely the hilliest ride I will do this year. This is a ride I signed up for last year, but then didn’t actually ride when it was 48°F and raining that Saturday morning. This year it was warmer (by about 15°F), though it rained on the ride down to Nelsonville and during most of the last half of the ride (including absolutely pouring right at the end as I pulled into the parking lot). I missed a turn early and ended up riding out and back on the back half of the course which is fine, it probably saved me 600 ft (183 m) of climbing. I ended up walking much of 2 of the hills. Temp (min/avg/max) – 59.0/61.1/64.4°F, no wind, but lots of rain, max grade – 19.4%, total climbing – 1590 ft (485 m), cadence (avg/max) – 67.8/98, HR (avg/max) – 148.4/183, HRM zones 3-5 2:00, power (avg/max) – 131/1351W. 29.22 mi (47.03 km) in 2:21:02, avg – 12.43 mph (20.00 km/h), max – 40.3 mph (64.9 km/h). According to mapmyride.com, 2 cat 5 climbs, one 0.8 mi long, the other 1.0 mi long, and note that max grade up there.

The Year in Riding (2016)


Just like last year, I’m late putting together my end of year wrapup. This year was obviously better than last year, but I was out of town for all the nice weather days in the last 6 weeks of the year, so I fell just short of my mileage from 2013 and 2014. Having said that, it was a very good year.  I only had 5 rides all year where I averaged under 15 mph. I added cadence and power meters in March which added some interesting data to my rides. I’m still figuring out how to make best use of it, but that’s for this next year.

I rode 5 of the 6 organized rides I paid for this year. The first one, the Tour de Forest was just too friggin cold, it was in the low 40s, so I decided to stay home and be warm.

  • Ride 2 Recovery Honor Ride Ohio – 31.34 mi (50.44 km) in 1:51:40, avg – 16.84 mph (27.10 km/h), beat last year’s time by almost 10 minutes.
  • Tour de H2O – 51.48 mi (82.85 km) in 3:07:59, avg – 16.43 mph (26.44 km/h), weather looked iffy at the start and for most of the ride I thought I’d finish in under 3 hours until a couple of late hills put an end to that.
  • Tour de Cause – 42.81 mi (68.90 km) in 2:48:46, avg – 15.22 mph (24.49 km/h), very hilly ride.
  • Pedal with Pete – 63.59 mi (102.34 km) in 3:45:24, avg – 16.93 mph (27.25 km/h), beat last year’s time by 7 minutes.
  • Ox Roast Ride – 62.17 mi (100.05 km) in 3:51:30, avg – 16.11 mph (25.93 km/h), my second metric century.

  • Total number of rides = 44 (most rides in a single year since I started keeping stats on RideWithGPS.com in 2012, 43 in 2013)
  • Total mileage – 1109.22 mi (1785.12 km)
  • Total time – 67:21:26
  • Total climbing – 20,660 ft (71.2 % of the way up Mt Everest)
  • Avg speed = 16.48 mph (26.52 km/h) (up from 15.38 last year)
  • Avg time of ride = 1:31:51 (down from 2:00:38 in 2014 and 1:34:40 last year)
  • Avg length of ride = 25.21 mi (40.57 km) (down from 30.91 in 2014, but up from 24.26 last year)
  • Rides over 20 mi = 29
  • Rides over 29.75 mi = 10 (down from 16 in 2014, but up from 8 last year)
  • Rides over 50 mi = 3 (down from 6 in 2014, up from 2 in 2015, 2013 and 2012)
  • Rides over 1:30:00 = 14
  • Rides over 2:00:00 = 6
  • Rides over 3:00:00 = 3

Pedal with Pete 2016

This ride has always been one of my favorites.  This one is to raise money for cerebral palsy research.  I rode the 48 mile route the first few years, last year and this year, I rode the 64 mile (metric century) route.  When I hit the first rest stop averaging 17.5 mph, I set myself a goal of finishing with an average of 17.0 mph or better.  I didn’t quite make that due mostly to the hills in the middle 16 miles and head winds in the last 18 or so miles, my secondary goal was to finish in better time than last year (though the route was slightly different due to a bridge being out), that I managed to accomplish.  Unfortunately, last year, this was my next to last good ride before I started having symptoms due to my heart issues.  This year, I’m expecting to have a few more good rides 🙂 .  The ride started drizzle in the first 4 miles and fog and clouds for much of the first 15 or 20.  I wouldn’t have minded if the overcast had lasted a bit longer, but it turned into a beautiful day to ride.  Rode most of the first 24 with a group of 4 other guys who were doing the 80 mile route.  Temp (min/avg/max) – 66.2/75.2/84.2°F, wind from S @ 5, max grade – 5.8%, total climbing – 777 ft (237 m), cadence (avg/max) – 75.5/99, HR (avg/max) – 149.5/170, HR zones 3-5 3:15, power (avg/max) – 160/523W.  63.59 mi (102.34 km) in 3:45:24, avg – 16.93 mph (27.25 km/h), max – 28.7 mph (46.2 km/h).  Personal bests on 5 of the 9 RideWithGPS segments on the route.

2016 Tour de Cause

It was a fantastic morning for a ride.  There was a high overcast for most of the ride, so it wasn’t too hot.  This ride is usually my hilliest ride of the year, and I suspect that will be the case this year, too.  My goal was to maintain an average speed of 15 mph and I did just barely manage to do that.  This one is to raise money for drug and alcohol addiction programs in Fairfield County (http://www.tourdecause.org/#intro) and is one I try to ride every year though I couldn’t ride it last year due to a conflict.  Temp (min/avg/max) – 66.2/71.8/80.6°F, winds calm, max grade – 10.1%, total climbing – 1257 ft (383 m), cadence (avg/max) – 74.0/112, HR (avg/max) 138.1/177, HR zones 3-5 1:40, power (avg/max) – 207/655W. 42.81 mi (68.90 km) in 2:48:46, avg – 15.22 mph (24.49 km/h), max – 37.7 mph (60.7 km/h).


2016 Ride 2 Recovery Honor Ride Ohio

20160528_075755

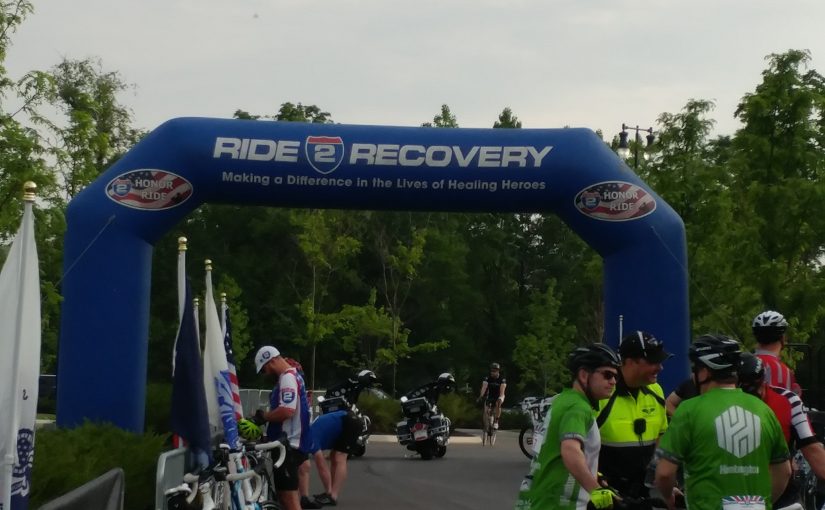
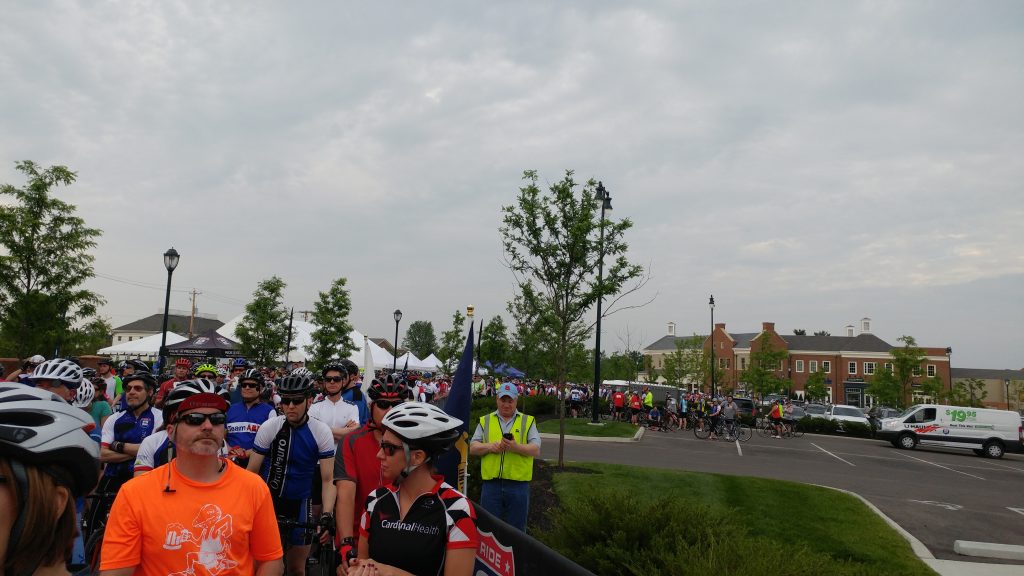
As has been the case the last two years, I kicked off my “organized riding season” and the Memorial Day holiday weekend with the 3rd annual Ride 2 Recovery Honor Ride Ohio in New Albany this morning.  There I got to ride with 900 of my closest friends (and Sen. Rob Portman, who I actually only saw before the ride, he missed last year’s ride because the Senate was still in session, don’t remember over what).  They cut back on the swag this year (no t-shirt and no medal at the end), I’m trying to decide how I feel about that.  It was a nice way to kick off the summer though.  It was just overcast enough that it didn’t get too hot, so it was perfect for riding.  The first 2 miles of the ride we were escorted by the New Albany and Reynoldsburg police which was nice, but kept the pace down.  I beat last years time by about 10 minutes, and I thought I had done a decent ride last year.  This ride is to support Ride 2 Recovery which, I believe, is doing important work, if you wish to donate, you can do so here.

The Year in Riding (2015)

64117352-IMGP3787

I’m kind of late in putting this together, but here is my annual wrap up of my year in riding for 2015.  The biggest thing that impacted my riding this year was my heart condition and stent.  I was a little behind the pace I had hoped to set, but was still feeling really good when I did the Pedal with Pete metric on 1 Aug (and my Basil-York cutoff route on 4 Aug), but things were clearly not right by my next ride on 13 Aug.

The upshot of all of that is that I didn’t get nearly as much riding in as I had hoped.  I only rode 4 of the 6 organized rides I paid for.

  • Ride 2 Recovery Honor Ride Ohio – 31.33 mi (50.42 km) in 1:59:53, avg = 15.68 mph (25.23 km/h).  Erin rode the 12 mile route and it was a little chilly, but a nice way to start the season off.
  • London Strawberry Festival –  45.03 mi (72.47 km) in 2:56:16, avg = 15.33 mph (24.67 km/h). Another chilly overcast one and headwind for pretty much the last 20 miles.
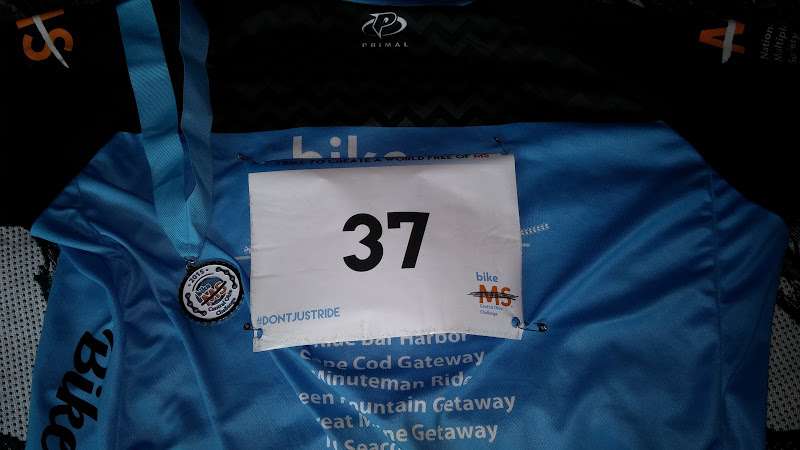
  • Bike MS Central Ohio Challenge – 54.37 mi (87.50 km) in 3:32:09, avg – 15.38 mph (24.75 km/h).  At the time of the ride I was tied for #4 among all fundraisers, I dropped out of the top 5 after the ride, but earned about $1200 for the cause.
  • Pedal with Pete – 64.49 mi (103.79 km) in 3:52:51, avg = 16.62 mph (26.75 km/h).  This year I did the metric century rather than the 48 miler and felt great.  Alas, the season was pretty much over for me at that point.

  •  Total number of rides = 28 (down from 36 in 2015 and 43 in 2014)
  • Total mileage = 679.39 mi
  • Total time = 44:10:44
  • Total climbing = 12, 120 ft
  • Avg speed = 15.38 mph (up from 15.37 last year, a bit surprising)
  • Avg time of ride = 1:34:40 (down from 2:00:38 last year)
  • Avg length of ride = 24.26 mi (down from 30.91 last year)
  • Rides over 20 mi = 17
  • Rides over 29.75 mi = 8 (half of last years total)
  • Rides over 50 mi = 2 (down from 6, but same as 2013 and 2012)
  • Rides over 1:30:00 = 14
  • Rides over 2:00:00 = 4
  • Rides over 3:00:00 = 2