Note: Just realized that I wrote this in Feb, but it was still in draft state until now (31 July). Sigh…
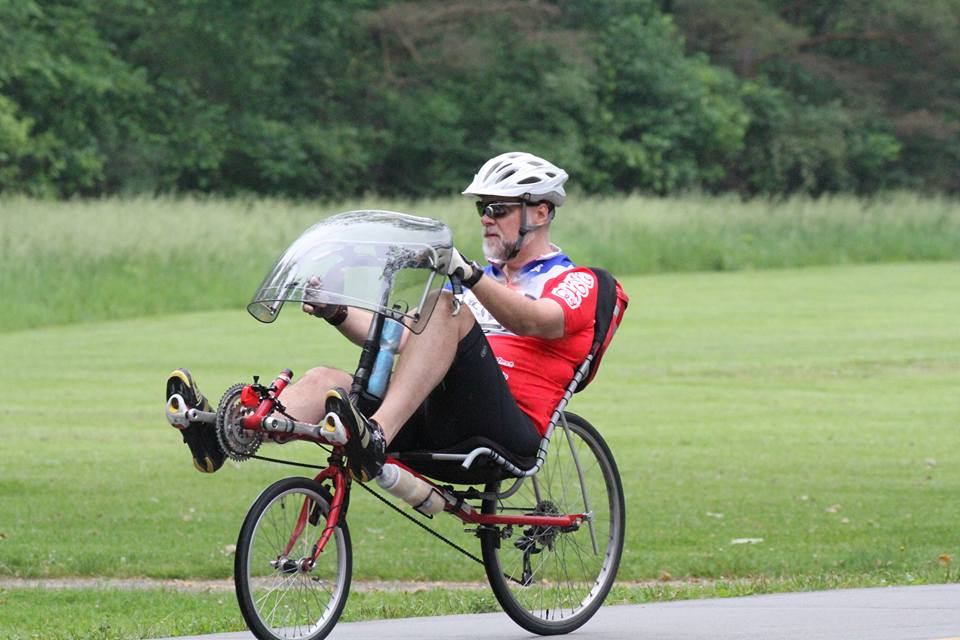
Running a little late, but I need to do my normal year-end wrap up of my time on the bike in 2017. Unfortunately, due to a foot injury and lots of traveling, I didn’t get to ride nearly as much as I would have liked. This is the fewest miles I’ve ridden (in a year without major heart issues) since I first got back on my bike 6 years ago.
I rode 4 of the 6 organized rides I paid for this year. The first one was the Tour de Forest which I registered for, but didn’t ride last year because it was just too friggin cold, This year it was warmer, but it poured down rain during the last half of the ride. I missed the Honor Ride for the first time in 4 years due to a flat tire that couldn’t be repaired without buying a new tire. I also was off the bike for 5 weeks at the peak of the season (early-July to mid-Aug) due to a foot injury that resulted in a Doctor prescribing orthotics due to what is apparently arthritis in the ball of the left foot.
- Tour de Forest – 29.22 mi (47.03 km) in 2:21:02, avg – 12.43 mph (20.00 km/h), max grade – 19.4%, total climbing – 1590 ft (890 m). I ended walking up significant portions of 2 of the hills.
- London Strawberry Festival Ride – 44.10 mi (70.97 km) in 2:57:28, avg – 14.91 mph (24.00 km/h). Headwinds and the climbs (such as they were) in the first half had me averaging only 13.7 mph (22.0 km/h) at the 23 mile mark. Strawberries at the rest stops, but not at the finish.
- Tour de Buckeye Lake – 25.41 mi (40.89 km) in 1:49:45, avg – 13.89 mph (22.35 km/h). Some hills and some wind. This is a brand new ride and was kind of fun. Not sure if I’ll ride it next year (kind of depends on when it is), but the food at the winery was really good.
- Ox Roast Ride – 29.27 mi (47.11 km) in 1:56:37, avg – 15.01 mph (24.16). I actually missed a turn (and had paused the GPS and forgot to restart it after the last rest stop). It was actually every bit of a metric half-century at right around 2 hours. I couldn’t wait for my ox sandwich this year though.
- Total number of rides = 25
- Total mileage – 540.53 mi
- Total time – 35:32:09
- Total climbing – 10,499 ft (36.2% of the way up Mt Everest)
- Avg speed = 15.21 mph (24.48 km/h)
- Avg time of ride = 1:25:17
- Avg length of ride = 21.62 mi (34.79 km)
- Rides over 20 mi = 15
- Rides over 29.75 mi = 3
- Rides over 50 mi = 0 (for the first time since 2012)
- Rides over 1:30:00 = 7
- Rides over 2:00:00 = 2
- Rides over 3:00:00 = 0
