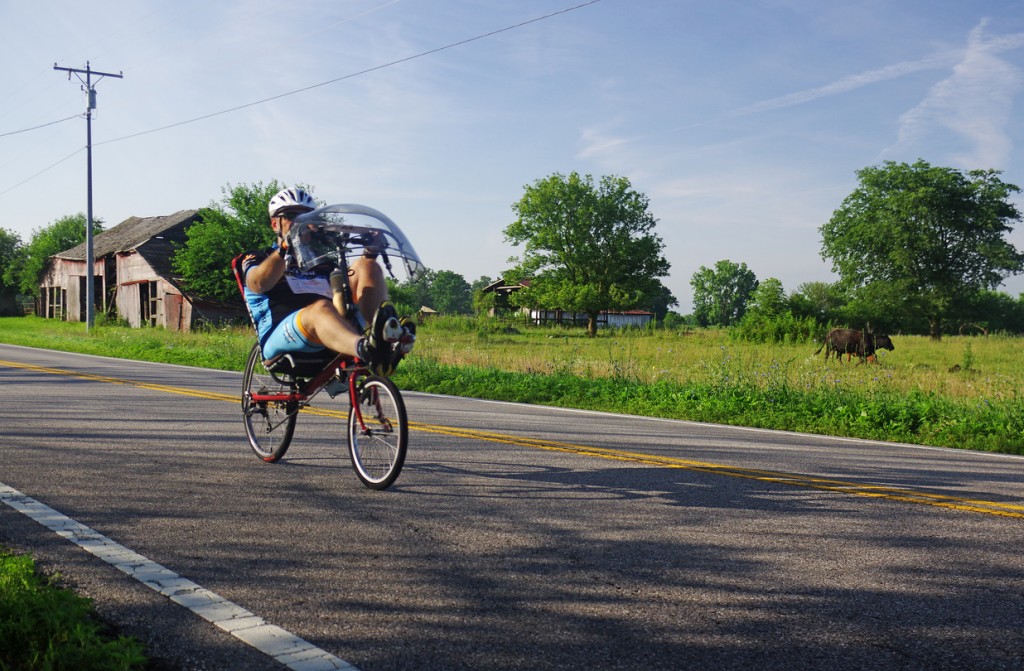
I’m kind of late in putting this together, but here is my annual wrap up of my year in riding for 2015. The biggest thing that impacted my riding this year was my heart condition and stent. I was a little behind the pace I had hoped to set, but was still feeling really good when I did the Pedal with Pete metric on 1 Aug (and my Basil-York cutoff route on 4 Aug), but things were clearly not right by my next ride on 13 Aug.
The upshot of all of that is that I didn’t get nearly as much riding in as I had hoped. I only rode 4 of the 6 organized rides I paid for.
- Ride 2 Recovery Honor Ride Ohio – 31.33 mi (50.42 km) in 1:59:53, avg = 15.68 mph (25.23 km/h). Erin rode the 12 mile route and it was a little chilly, but a nice way to start the season off.
- London Strawberry Festival – 45.03 mi (72.47 km) in 2:56:16, avg = 15.33 mph (24.67 km/h). Another chilly overcast one and headwind for pretty much the last 20 miles.
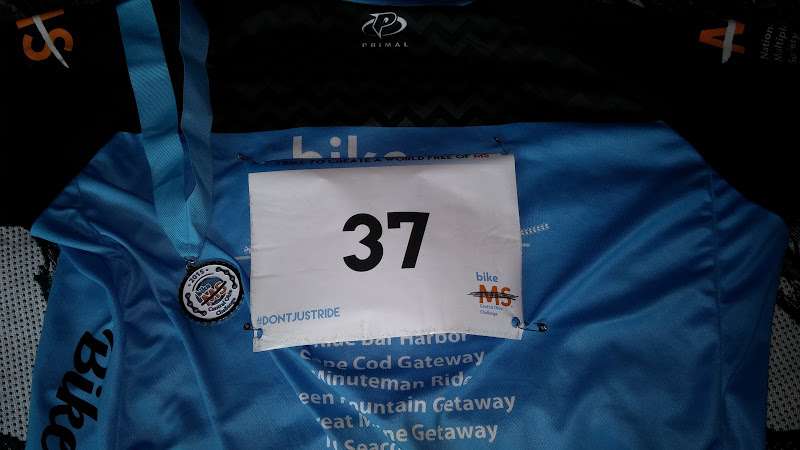
- Bike MS Central Ohio Challenge – 54.37 mi (87.50 km) in 3:32:09, avg – 15.38 mph (24.75 km/h). At the time of the ride I was tied for #4 among all fundraisers, I dropped out of the top 5 after the ride, but earned about $1200 for the cause.
- Pedal with Pete – 64.49 mi (103.79 km) in 3:52:51, avg = 16.62 mph (26.75 km/h). This year I did the metric century rather than the 48 miler and felt great. Alas, the season was pretty much over for me at that point.
- Total number of rides = 28 (down from 36 in 2015 and 43 in 2014)
- Total mileage = 679.39 mi
- Total time = 44:10:44
- Total climbing = 12, 120 ft
- Avg speed = 15.38 mph (up from 15.37 last year, a bit surprising)
- Avg time of ride = 1:34:40 (down from 2:00:38 last year)
- Avg length of ride = 24.26 mi (down from 30.91 last year)
- Rides over 20 mi = 17
- Rides over 29.75 mi = 8 (half of last years total)
- Rides over 50 mi = 2 (down from 6, but same as 2013 and 2012)
- Rides over 1:30:00 = 14
- Rides over 2:00:00 = 4
- Rides over 3:00:00 = 2

